Changelog
Follow up on the latest improvements and updates.
RSS
improved
Expanded Currency Options

Here you can see in action: https://twitter.com/i/status/1784612964969963985
Since our inception, the US Dollar (USD) has been the sole currency option available in our system. We've heard your feedback loud and clear, and we’re thrilled to announce a major enhancement based on your requests!
What’s New?
We now offer a significantly expanded range of currency options. Dive into a selection of over 169 currencies to tailor your experience more closely to your local needs and preferences.
Setting Up Your Preferred Currency
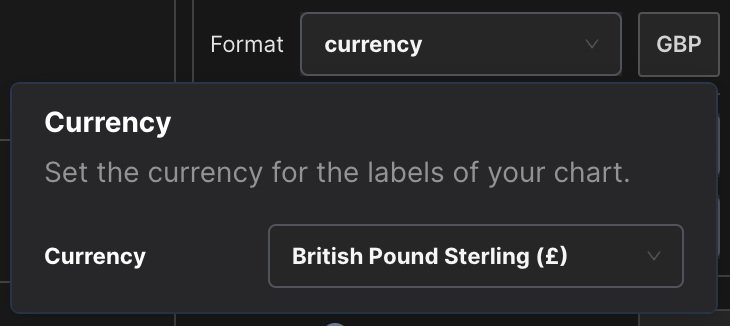
- To explore and select from the new currency options, simply navigate to the "Currency" settings in your dashboard.
- While USD will remain the default, a simple click on the USD button will open up a dropdown menu where you can either browse or search for your preferred currency.
- You can search by the full name of the currency, like "United States Dollar," or by its abbreviation, such as "USD" or "GBP."
Where You'll See Changes
These currency options are now integrated throughout the system and will be reflected in all labels, as well as the x-axis and y-axis of your charts, making your data analysis even more intuitive and customized.
We hope you enjoy this new level of customization and that it makes your experience with our platform even more effective and enjoyable. As always, we're here to support you, so please don't hesitate to reach out if you need help setting up or have any feedback!
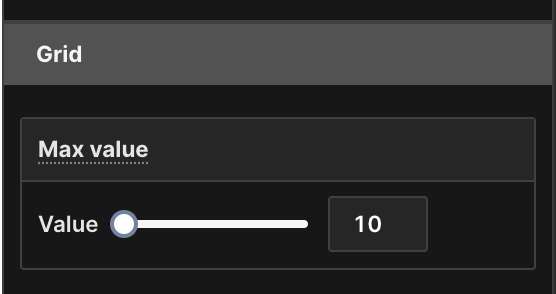
As requested by some of you, we have implemented the Max value for radar charts.

You can now set max value in the "Grid" section on righ hand-side. As soon as you click on the button "Max value", you can define the max value yourself.
We have heard from some customers that "cumulative" feature does not work properly. In multi-column charts only the first column was cumulative but not the other columns. We have fixed that issue now. Thank you for pointing out this issue.

improved
KPI number formatter
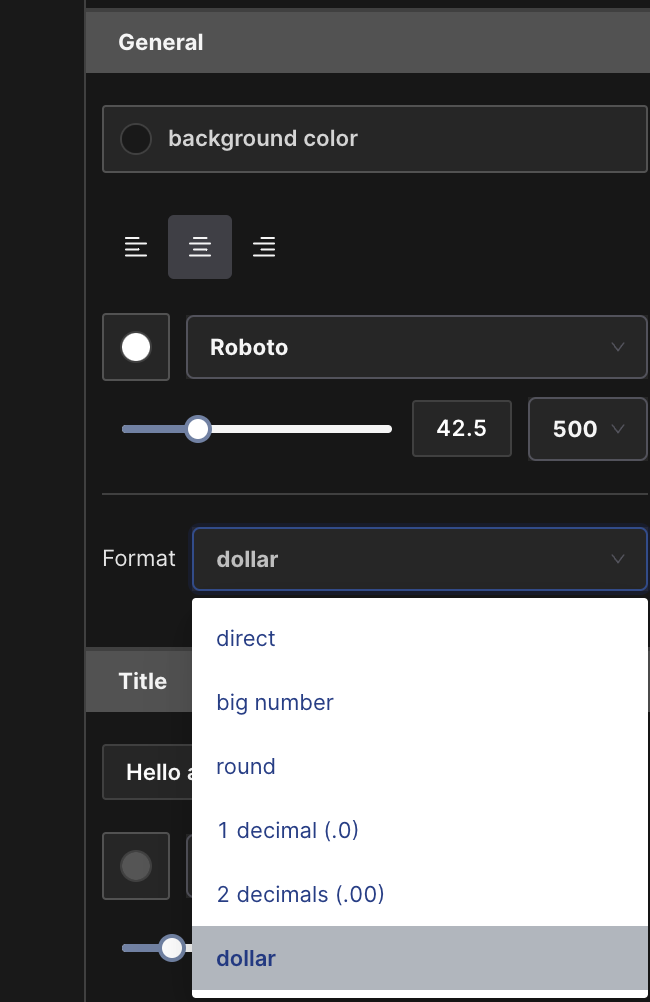
We have implemented an improvement that has been requested by many for a long time. Formatting of the numbers in KPI chart.

You can now format the KPI number in the same way as the other charts. We will not stop here. We will soon give you even more flexibility in number formatting. Different currencies, thousands separator, decimal separator. Stay tuned!
When creating a bar chart, the values were always displayed correctly in a vertical view. When switching from vertical to horizontal, the values were never correct and the values in the chart were always wrong. This error has now been fixed and the values are always correct regardless of vertical or horizontal.
You can now use your tags in single or combined mode
A pretty useful feature for your next dashboard or KPIs displayed!
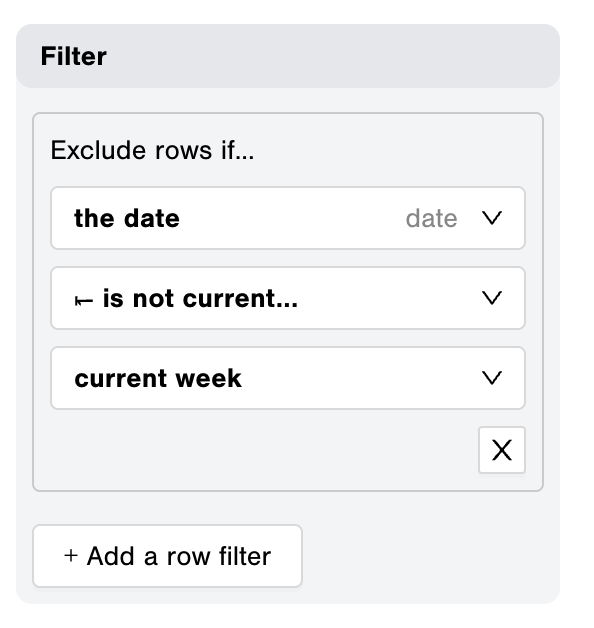
You can now filter your rows and exclude them if they have a property outside of the current day, current week (since Monday), current month (since the 1st), or current year (since the 1st of Jan.).
It works with columns of type:
date
, created on
, updated on
.
Now charts with over 500 rows are automatically cached. It means that you can load huge databases very quickly. One inconvenience is that we can't detect deleted rows due to Notion API limitations. Learn more about cached chart